If you’ve been in IT for more than a week, you know the feeling.
Not a blue screen, not a server-down emergency, but a small, persistent, and maddening “ghost in the machine”.
This is the technical companion piece to: 10x Faster IT Troubleshooting: How I Used AI to Solve a Mysterious Windows Process Loop
A user- or worse, you – are noticing a strange system behaviour.
The classic is a flashing “waiting” cursor, a “blip” every second, or a Task Manager window that seems to be constantly refreshing.
The Quick Fix TLDR:
- Check the basics first:
- Task Manager check for basic High RAM, CPU, Memory apps.
- Check Event Viewer for obvious spam from a specific app.
- Check for Updates to see if anything is queued or recently (since issue) been updated.
- Pending reboots that might be causing a service to fail.
- Check Drivers: ensure all main drivers (GPU, chipset, network) are current.
- Ask AI: take a screenshot or screen video and upload itwith the issue, and what your step 1 found.
In this case: - Use ProcExp.exe
- If nothing obvious appears, move onto ProcMon.exe
- Use AI as a filter helper
- It knows the filters and syntax better than you. (unless you use these tools alot…)
- Done.
Your first move? You open Task Manager. And you see… nothing. No app is hogging the CPU, memory is fine, and the disk is idle.
The problem lies in the fact that Task Manager is a dashboard. It’s great for seeing what’s currently running and what’s using resources. It is terrible for catching a process that starts, runs for 100 milliseconds, and then terminates. It’s born and dies in the blink of an eye, never troubling the dashboard’s refresh cycle.
When Task Manager fails, you need to bring out the right tools. For GUI-loving admins, that means the Sysinternals Suite. This guide will show you how to use two of its most powerful tools- Process Explorer and Process Monitor- to catch that “ghost” process.
Our Case Study: The Mysterious Flashing Cursor
This tutorial isn’t just theory. This exact method is how I solved a maddening problem on my own Windows 11 machine:
- The Symptom: For 5-10 minutes at a time, my mouse cursor would flash the “waiting” icon every single second.
- The Investigation: Task Manager showed absolutely nothing. Ending common apps like my browser or screenshot tool did nothing.
- The Cause: A “ghost” process was launching and terminating, over and over.

Phase 1: The Standard Sysadmin Checks
Before diving into heavy tools, every admin should run through the “quick fix” checklist. Sometimes the solution is simpler than you think. My first steps were:
- Check Event Viewer: I looked through the System and Application logs. I saw a few DNS-related entries from earlier, but nothing critical and nothing that matched the timing of the flashing cursor.
- Check for Updates: I manually ran Windows Update to check for pending updates or, more importantly, a pending reboot that might be causing a service to fail. The system was fully up to date.
- Check Drivers: I ensured all my main drivers (GPU, chipset, network) were current.
With these simple checks ruled out, I knew this was a deeper issue.
Phase 2: Identifying the Type of Problem
My core symptom- the flashing cursor- told me how the problem was behaving. It wasn’t a hung app or a memory leak. The rhythmic, once-per-second “blip” was a classic sign of a process loop. Something was trying to start, failing instantly, and then trying again, over and over.
This is where the modern troubleshooting toolkit comes in. Traditionally, I would have had to just know this from experience, like I did; but today, this is a perfect task for an AI assistant.
A junior engineer could have taken a 15-second screen recording (like the one above) and uploaded it to an AI like Gemini.
"I've got an intermittent flashing 'waiting' cursor on Windows 11 (see attached). It's not a high-CPU process; Task Manager is clean. I've already restarted explorer and other common apps. I suspect it's a process starting and stopping too fast to see. What's the best way to catch it, which logs should we look at first, or which tools should we spin up?"The multimodal understanding of these tools is strong enough to analyse the video and suggest,
"The rhythmic flashing of your cursor, combined with a quiet Task Manager, strongly suggests a rapid process loop."The AI is a tool, just like procmon. Using it here saved me from guessing and allowed me to move straight to the right tools for catching a process loop.

Tool 1: Process Explorer (The Live View)
Your first step up from Task Manager is Process Explorer (procexp). Think of it as Task Manager’s brilliant, all-knowing older brother. It’s a free, standalone GUI tool from Microsoft.
➡️ How to get it: You can download the entire Sysinternals Suite directly from Microsoft here: https://learn.microsoft.com/en-us/sysinternals/downloads/sysinternals-suite.
As a bonus, it’s also now available to install directly from the Microsoft Store in Windows.
For catching fast-moving processes, procexp has one killer feature: Difference Highlighting.
How to Use It:
- In Process Explorer, click on Options in the top menu.
- Go to Difference Highlight Duration…
- The default is 1 second. Change this to 3 or 5 seconds.
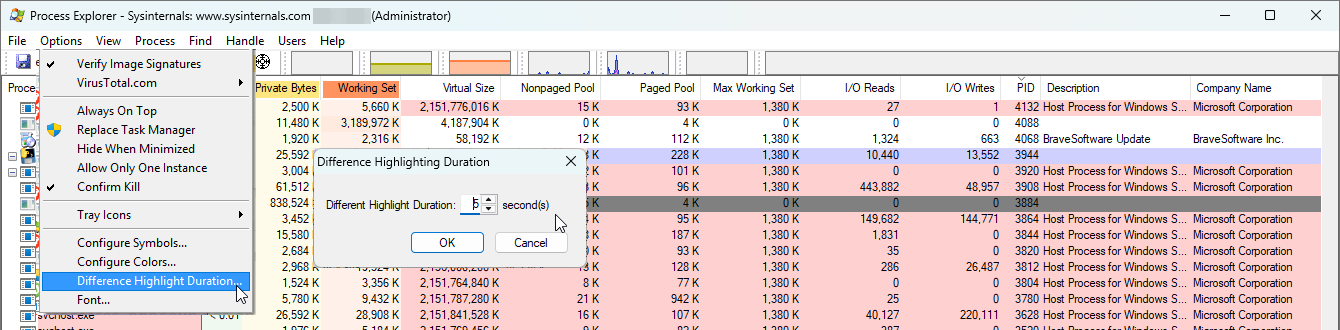
Now, just watch the main process list.
- Processes that are newly created will flash bright green.
- Processes that have just terminated will flash bright red.
For many “ghost” processes, this is all you need. You’ll see a process name flash green, then red, over and over. You’ve found your culprit.
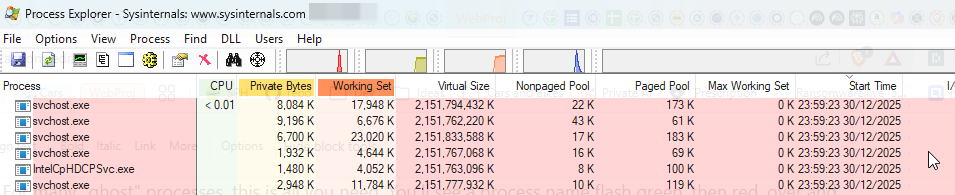
In my case, the loop was so fast that this was just a blur of red and green flashes. It confirmed my theory but didn’t clearly identify the process. It was time to bring in the “CCTV.”
What If You Can See the Ghost Process?
Let’s say the highlighting does show you a process, but it’s still hard to pin down. Here are two more ProcExp tricks:
- Sort by Start Time: Right-click the column headers (like ‘CPU’), choose Select Columns…, go to the Process Performance tab, and check Start Time. Now, click this new column. Your looping process will repeatedly jump to the top of the list as it’s created.
- Check Command Line: Once you spot the process, right-click it and go to Properties…. The Image tab will show you the full Command line path. This is vital. A process named
svchost.exeis meaningless, but seeing its command line might show you it’s running a specific, problematic service.
Tool 2: Process Monitor (The “CCTV” Log)
If Process Explorer is the live video feed, Process Monitor (procmon) is the high-definition, frame-by-frame “CCTV” recording of everything happening on your system. It logs every file read, every registry key access, and- most importantly for us- every process creation.
Running it with no filter is like drinking from a firehose. You’ll get millions of events in seconds. The key is to apply a filter.
How to Use It (Step-by-Step):
This is the definitive, 60-second method to find your “ghost” process.
- Run
procmon.exeas an administrator. It will immediately start capturing. - Stop the Capture: Click the Magnifying Glass icon in the toolbar to stop the flood of data (or press Ctrl+E).
- Clear the Log: Click the Eraser icon to clear the events captured so far (or press Ctrl+X).
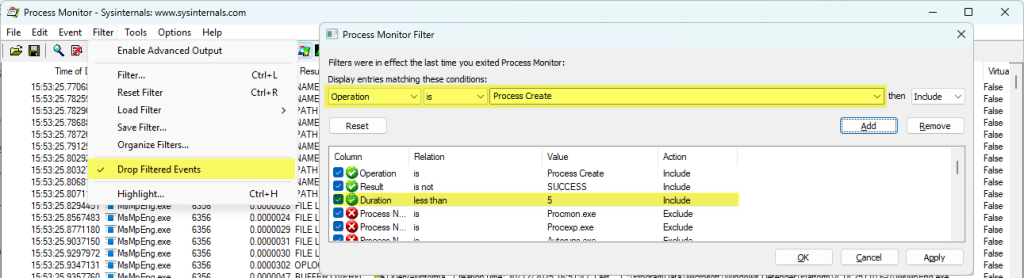
- Set the Filter: Click the Filter icon (the funnel) in the toolbar (or press Ctrl+L).
- In the filter window, create the following rule:
OperationisProcess Create- Click the Add button. The rule will appear in the list.
- Click Apply, then OK.
- Set One More Vital Option: Go to the Filter menu and make sure Drop Filtered Events is checked. This is crucial. It tells
procmonto immediately discard any data that doesn’t match your filter. Without this,procmonwill still log millions of events in the background, consuming all your memory. - Start the Capture: Click the Magnifying Glass icon again (Ctrl+E) to start capturing.
Now, wait for your “blip” or flashing cursor to happen. Instead of a million-line log, your procmon window will be a clean, simple list of only the processes being created.
The Result: Finding Our Culprit
In my case, the moment the flashing cursor started, my procmon log filled up with the exact same entry, once per second:
rundll32.exe C:\WINDOWS\system32\davclnt.dll,DavSetCookie NAS-Primary http://NAS-Primary/Multimedia/
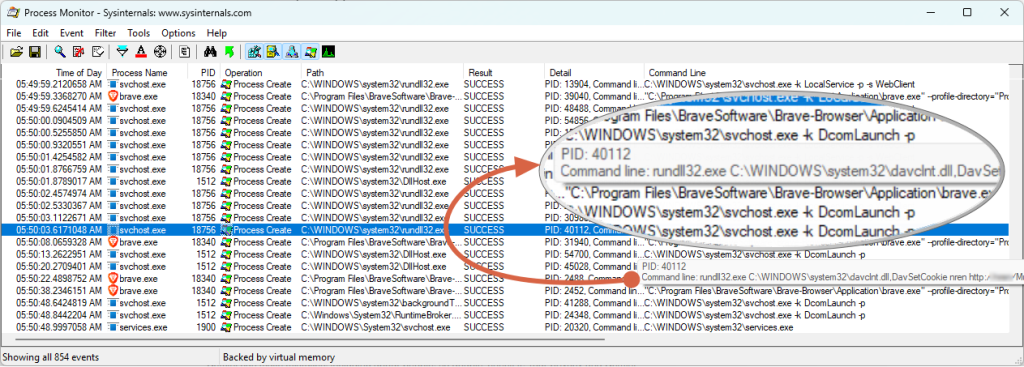
This is the “smoking gun.” Here’s what it means:
rundll32.exe: A generic Windows program used to run functions from a DLL.davclnt.dll: This is the Windows WebClient service. It’s used to connect to WebDAV (HTTP-based) network shares.- The rest: It was trying (and failing) to connect to my NAS, to set a cookie for the
Multimediafolder.
This kind of WebDAV call can be triggered by many things. It’s often an application trying to access a network path that has become unavailable. Common culprits include media servers like Plex, Jellyfin, Sonarr, or Radarr trying to scan a library. It can also be caused by modern WebView2 apps or even Microsoft 365 services that have a ‘pinned’ or ‘recent link’ to a file on that network share.
A Pro Tip: Don’t Ignore the Logs!
Here’s the “lesson learned” part.
After I found the culprit, I remembered seeing emails from my NAS.
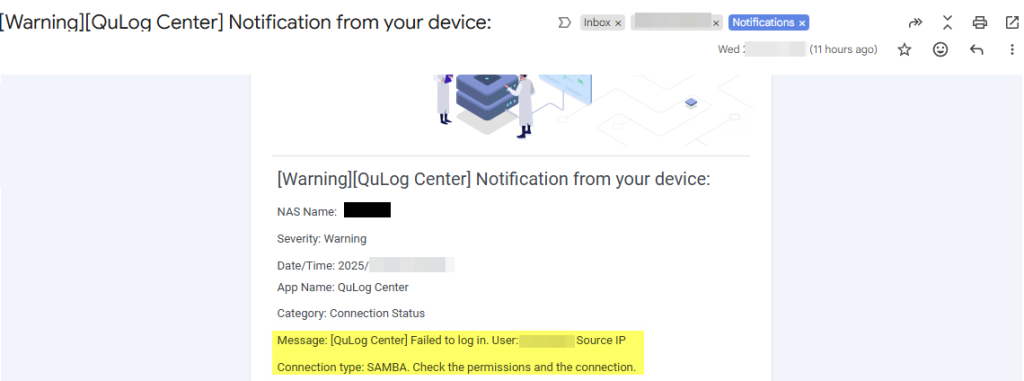
I had set up QuLog Center notifications on my QNAP, and sure enough, my inbox had warnings I had muted for “later.”
They all said: [QuLog Center] Failed to log in. User: X Source IP: x.x.x.x Connection type: SAMBA.
If I had put two and two together earlier, I would have known exactly where to look.
From Clue to Solution (Connecting the Dots)
The procmon clue was davclnt.dll. My immediate question was, “Why is my PC using WebDAV to connect to my NAS? It should be using SMB or NFS.”
This is where my AI co-pilot became essential again. I presented it with the two clues:
"I've got this process spamming, and my server is blocking it but I still have access? What is going on here if everything works as it should and SMB functions?
My PC is spamming davclnt.dll process 'creates'.
My NAS is logging "Failed to log in" via SMB."
This is a deep-cut, “textbook” knowledge problem. As I explained in my companion post on AI-assisted troubleshooting, the AI provided the answer instantly. This is a classic (and obscure) Windows behavior. When a primary SMB connection to a network share fails, Windows will sometimes try to “help” by falling back to the WebDAV protocol.
This one piece of information connected everything.
The Root Cause:
- A few days earlier, I had updated the SMB service implementation version on my NAS (not the full firmware).
- My PC’s saved, cached credential in Windows Credential Manager was now stale, and the NAS was rejecting it (the SMB failure log).
- This “SMB fail” triggered the “WebDAV fallback” loop (the
davclnt.dllspam). - The problem wasn’t obvious because my main way of accessing the NAS, the Qsync client, runs over HTTPS and was working perfectly. I had no other symptoms.
The [SOLVED] Fix:
- I opened Windows Credential Manager (just search it in the Start Menu).
- I went to Windows Credentials.
- I found the saved, stale credential for my NAS (
NAS-Primary). - I clicked it and selected Remove.

The instant I removed it, the procmon log stopped, and the flashing cursor was gone.
I browsed to the share again in Explorer, typed my password, and a new, valid credential was saved.
Problem solved.
Conclusion: Your New GUI Troubleshooting Toolkit
Task Manager is great, but it has its limits. When you’re hunting a “ghost” process, you need to upgrade your toolkit. The modern sysadmin’s GUI-first toolkit for this kind of problem is a powerful trio:
- Task Manager: The “dashboard” (what’s happening now).
- Process Explorer: The “live video feed” (who is coming and going).
- Process Monitor: The “CCTV log” (what exactly happened, when, and why).
- An AI Assistant (like Gemini): The “expert in the room” (to analyze symptoms and connect the dots).
For any sysadmin who prefers a powerful, GUI-first approach to troubleshooting, these tools are indispensable.
Sysadmin Tip
– me (…an idiot!)
Set up meaningful log notifications, don’t ignore them – and actually read them!
If you found any of this useful, have a a wee gander across any of my other articles, or give me a follow on https://x.com/RealistSec where I moan constantly about IT, AI, web dev and Technology stuff!
Here’s the version of this to send to your boss to help convince them to pay for a nice shiny PRO AI license for you: “10x Faster IT Troubleshooting: How I Used AI to Solve a Mysterious Windows Process Loop“ – Good Luck!!
![[Solved] Help! Windows 365 Cloud PC Switch Feature Has Frozen My Local Host PC.](https://cannotdisplay.com/wp-content/uploads/2025/12/Win365-Cloud-PC-via-Switch-1260x264.png)


![What GPU’s does Windows Server 2025 support for GPU Partitioning? [Solved]](https://cannotdisplay.com/wp-content/uploads/2024/11/Server-2025-GPU.png)