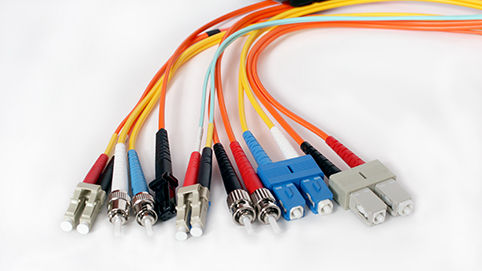
Fibre: Types of Fiber Optic Connectors

Types of Fibre Optic Connectors

Fibre optic connectors are used to join two fibre optic cables together or to connect a fibre optic cable to a device such as a router or switch. There are many different types of fibre optic connectors available, each with its own unique features and applications. Here are some of the most common types:

  • SC Connectors: SC connectors are a popular choice for use in telecommunications and networking applications. They feature a push-pull design and use a snap-in mechanism to secure the connection.
  • LC Connectors: LC connectors are similar to SC connectors, but they are smaller in size and more compact. They are often used in high-density installations where space is at a premium.
  • ST Connectors: ST connectors are a legacy type of fibre optic connector that is still in use today. They feature a bayonet-style locking mechanism and are commonly used in networking and telecom applications.
  • FC Connectors: FC connectors are a popular choice for use in high-performance applications such as data centers and labs. They feature a threaded design for secure connections and are resistant to vibration and temperature changes.
  • MTP/MPO Connectors: MTP/MPO connectors are used for multi-fibre cables and are commonly used in data center and telecom applications. They feature a high-density design and use a push-pull mechanism to secure the connection.

Each type of fibre optic connector has its own unique features and benefits. It is important to choose the right connector for your specific application to ensure a reliable and efficient connection.

[Solved] Fibre: What is fibre multiplexing?

Fibre: What is fibre multiplexing?

Fibre multiplexing is a technique used to transmit multiple streams of data over a single fiber optic cable. This allows for a large amount of data to be transmitted efficiently and quickly.

Imagine you have a bunch of different colored pencils, and you want to send them all to your friend who lives far away. One way to do this would be to pack each pencil into a separate box and send it through the mail. This would work, but it would take a lot of time and be expensive to send all those boxes.

Instead, you could put all the pencils into one big box and send them all at once. This is like what fibre multiplexing does with data. Instead of sending each piece of data separately, fibre multiplexing combines many different pieces of data into one big bundle and sends them all together through a fiber optic cable. This way, you can send a lot of data very quickly and efficiently.

There are several different methods of fibre multiplexing, including time-division multiplexing (TDM), wavelength-division multiplexing (WDM), and dense wavelength-division multiplexing (DWDM). These methods differ in how they combine the multiple streams of data, but the basic concept is the same: using a single fiber optic cable to transmit multiple streams of data simultaneously.

Fibre multiplexing is used in a variety of applications, including telecommunications, internet service providers, and cable TV. It is an important technology that allows us to transmit large amounts of data over long distances quickly and efficiently.

Pros and Cons of using VLANS over separate physical networks

I recently had to write out a list of pro’s and con’s to present to a client who just couldn’t work out why VLANS would work out cheaper than separate physical networks. In doing this i reminded myself that whilst VLANS do give alot more control, there are maybe quite a few situations where seperate physical networks could be more beneficial. It’s not all black and white. Here is the shortened version of the list i came up with:

Pros of using VLANs:

  • Flexibility: VLANs allow you to segment your network into different logical networks, which can be useful for separating different types of traffic or users. This can make it easier to manage and secure your network.
  • Cost savings: Using VLANs can be more cost-effective than setting up separate physical networks, as you can use a single network infrastructure to support multiple logical networks.
  • Simplicity: VLANs can make it easier to manage and troubleshoot your network, as you can isolate different types of traffic and users into different logical networks.

Cons of using VLANs:

  • Complexity: VLANs can add complexity to your network, as you need to configure and manage the VLANs themselves.
  • Limited scalability: VLANs can be limited in terms of how many devices can be assigned to a single VLAN.
  • Performance: VLANs can introduce some overhead and reduce performance compared to using separate physical networks.

Pros of using separate physical networks:

  • Simplicity: Using separate physical networks can be simpler to set up and manage than using VLANs.
  • Performance: Separate physical networks can offer better performance than VLANs, as there is no overhead introduced by the VLANs.

Cons of using separate physical networks:

  • Cost: Setting up separate physical networks can be more expensive than using VLANs, as it requires additional hardware and infrastructure.
  • Inflexibility: Separate physical networks offer less flexibility than VLANs, as you cannot easily segment your network into different logical networks.
  • Difficulty in managing and troubleshooting: Managing and troubleshooting separate physical networks can be more difficult than using VLANs, as you need to manage multiple physical networks rather than a single network infrastructure with multiple logical networks.

Here are a couple examples, the first is

When Vlans are preferable:

Imagine that you are setting up a network for a large office building with multiple departments. Each department has its own set of servers, workstations, and other network devices, and you want to ensure that the traffic from each department is kept separate from the others.

One option would be to set up separate physical networks for each department. However, this would be costly and inflexible, as it would require setting up separate network infrastructure for each department. Additionally, managing and troubleshooting multiple physical networks would be more complex than managing a single network infrastructure.

Instead, you could use VLANs to segment the network into different logical networks, one for each department. This would allow you to use a single network infrastructure to support multiple logical networks, while still keeping the traffic from each department separate. This would be more cost-effective and flexible than using separate physical networks, and it would be simpler to manage and troubleshoot.

When Separate physical networks are preferable:

Imagine that you are setting up a network for a large warehouse that will be used to store and track inventory. The warehouse will have a large number of sensors, RFID scanners, and other IoT devices that will be sending and receiving large amounts of data.

In this case, using VLANs to segment the network into different logical networks might not be sufficient to handle the large volumes of data being transmitted by the IoT devices. VLANs can introduce some overhead and reduce performance compared to using separate physical networks, so using separate physical networks might be necessary to ensure that the IoT devices have the bandwidth and latency they need.

Additionally, the warehouse network might be too large or complex to manage effectively using VLANs, in which case using separate physical networks might be simpler and more effective.

Diagnosing and Fixing Slow Network Performance: Part 2

Diagnosing and Fixing Slow Network Performance: Part 2

In Part 1 of this article, we covered some common causes of slow network performance and how to troubleshoot and fix them. Here are some more advanced steps that you can try if you are still experiencing slow network performance:

  • Check for bottlenecks. A bottleneck is a point in the network where the performance is slowed down due to a lack of capacity. You can use a tool such as Wireshark to identify bottlenecks in your network. Once you have identified the bottleneck, you can try to fix it by upgrading the hardware or reconfiguring the network settings.
  • Check for faulty cables. Faulty cables can cause slow network performance. Check all of the cables in your network, including Ethernet cables and power cables, to make sure they are in good condition. If you find any damaged cables, replace them.
  • Check for network congestion. Network congestion occurs when there are too many devices trying to access the network at the same time. You can use a tool such as netstat to see the number of connections on your network and identify any potential congestion. If you find that there is congestion, you can try reducing the number of devices on the network or upgrading the hardware to improve the performance.
  • Check for outdated software. Outdated software can cause slow network performance. Make sure that all of the software on your devices is up to date, including the operating system and applications.
  • Check for network misconfigurations. Network misconfigurations can cause slow network performance. Make sure that the network settings on your devices are correct and that there are no conflicting settings.

In conclusion, slow network performance can be caused by a variety of factors, including bottlenecks, faulty cables, network congestion, outdated software, and network misconfigurations. By following the steps outlined in Part 1 and Part 2 of this article, you can diagnose and fix the problem to improve the performance of your network.

Diagnosing and Fixing Slow Network Performance: Basics

If you are experiencing slow network performance, it can be frustrating and impact your productivity. There are many potential causes of slow network performance, ranging from outdated hardware to interference from other devices. In this article, we will cover some common causes of slow network performance and how to troubleshoot and fix them.

Check your internet connection speed. The first step in diagnosing slow network performance is to check your internet connection speed. You can do this by using an online speed test tool, such as Speedtest.net. This will give you an idea of the speed that you are getting from your internet service provider (ISP). If the speed is lower than what you are paying for, you may need to contact your ISP to troubleshoot the issue.

Check your router and modem. If your internet connection speed is fine, the next step is to check your router and modem. These devices are responsible for connecting your devices to the internet and can sometimes be the cause of slow network performance. You can try rebooting the router and modem to see if this helps. If the problem persists, you may need to update the firmware on the devices or consider replacing them if they are outdated.

Check for interference. Interference from other devices, such as cordless phones or microwave ovens, can cause slow network performance. Try moving the router to a different location and see if this improves the performance. You can also try using a different wireless channel to see if this helps.

Check for malware. Malware, such as viruses and worms, can slow down your network by consuming bandwidth and resources. Make sure that you have antivirus software installed and run a scan to check for malware.

Check for outdated hardware. If your devices are using outdated hardware, they may be unable to keep up with the demands of modern applications and websites. Consider upgrading your hardware, such as your router, modem, or computer, to see if this improves the performance.

In conclusion, slow network performance can be caused by a variety of factors. By following the steps outlined above, you can diagnose and fix the problem to improve the performance of your network.

[SOLVED] Resetting a Router or switch to Its Factory Default Settings

Resetting a Router or Switch to Its Factory Default Settings

At some point, you may need to reset your router or switch to its factory default settings. This could be for a variety of reasons, such as if you have forgotten the administrator password, if the device is not functioning correctly, or if you want to sell or dispose of the device and want to remove all of your personal configuration settings.

Regardless of the reason, resetting a router or switch to its factory default settings is a relatively straightforward process. Here are the steps to follow:

Locate the reset button on the device. This is usually a small button or switch that is labeled “reset” or “restore factory defaults.” It is usually located on the back or bottom of the device.

Press and hold the reset button for a few seconds. The exact amount of time will vary depending on the device, but it is usually around 10 seconds.

Release the reset button. The device should now reset to its factory default settings. This may take a few minutes, depending on the device.

Once the device has reset, you will need to reconfigure it. This will typically involve connecting to the device’s web-based configuration interface and setting up the basic settings, such as the administrator password, the time and date, and the network settings.

It’s worth noting that resetting a router or switch to its factory default settings will erase all of your personal configuration settings, so be sure to make a note of any important settings before you reset the device. Additionally, if you are disposing of the device, be sure to perform a factory reset to ensure that all of your personal data is removed from the device.

In conclusion, resetting a router or switch to its factory default settings is a simple process that can be useful in a variety of situations. By following the steps outlined above, you can easily reset your device and reconfigure it to meet your needs.

Using Wireshark to Troubleshoot Network Connectivity Issues: Summary

Wireshark is a powerful tool for network support technicians who are trying to troubleshoot connectivity issues and optimize network performance. In this series, we have covered a number of features in Wireshark that can be particularly useful for troubleshooting network issues, including:

  • “Follow TCP Stream”
  • “Decode As”
  • “IO Graphs”
  • “Expert Infos”
  • “Time Sequence Graph (tcptrace)”
  • “Conversation Filter”
  • “Graphical Time Sequence (grep)”
  • “Statistics”

In the following summary, we will provide a brief overview of each of these features and how they can be used to troubleshoot network issues.

  • “Follow TCP Stream” allows you to see all of the packets in a particular TCP stream in a single window, making it easier to understand the conversation between two devices.
  • “Decode As” allows you to change the way that Wireshark decodes and displays a particular protocol, which can be useful when the default decoding is not correct or when you want to see more detailed information about the protocol.
  • “IO Graphs” allows you to create graphs of packet and byte rates over time, which can help you identify trends and patterns in network traffic.
  • “Expert Infos” displays alerts and warnings about potential problems with the packets being captured, such as retransmissions or out-of-order packets.
  • “Time Sequence Graph (tcptrace)” displays a graph of TCP packet sequence numbers over time, which can help you identify problems with the TCP connection.
  • “Conversation Filter” allows you to filter the packets being displayed based on their source and destination addresses, which can be useful when you are trying to focus on a specific conversation.
  • “Graphical Time Sequence (grep)” displays a graph of packet transmission times over time, which can help you identify trends and patterns in network traffic.
  • “Statistics” provides a wide range of statistical information about the packets being captured, including “Protocol Hierarchy,” “Endpoints,” “IO Graphs,” “Conversations,” “Flow Graph,” “TCP Stream Graphs,” and “HTTP.”
  • “Protocol Hierarchy” displays a graphical representation of the protocols being used on your network, with the most frequently used protocols at the top. It is useful for identifying potential problems with your network.

Overall, Wireshark is a powerful tool that can be used to troubleshoot a wide range of network connectivity issues. By using the features discussed in this series, network support technicians can quickly and effectively identify and resolve problems with their networks, improving overall performance and reliability. Whether you are a seasoned network support professional or just starting out, learning how to use Wireshark is a valuable skill that can help you troubleshoot and optimize your network.

[SOLVED] Using Wireshark to Troubleshoot Network Connectivity Issues: Statistics

Using Wireshark to Troubleshoot Network Connectivity Issues: Statistics

In addition to the “Follow TCP Stream,” “Decode As,” “IO Graphs,” “Expert Infos,” “Time Sequence Graph (tcptrace),” “Conversation Filter,” and “Graphical Time Sequence (grep)” features, Wireshark also includes a tool called “Statistics” that provides a wide range of statistical information about the packets being captured.

To use the “Statistics” feature, simply select the “Statistics” menu and then choose the type of statistical information that you want to view. Wireshark provides a number of different options, including “Protocol Hierarchy,” “Endpoints,” “IO Graphs,” “Conversations,” “Flow Graph,” “TCP Stream Graphs,” and “HTTP.”

Part A: How to Use the Protocol Hierarchy
To use the “Protocol Hierarchy” option in the “Statistics” feature in Wireshark, follow these steps:

Select the “Statistics” menu and then choose “Protocol Hierarchy.”
In the “Protocol Hierarchy” window, you will see a graphical representation of the protocols being used on your network, with the most frequently used protocols at the top.
To view more detailed information about a specific protocol, click on the protocol in the graph. This will open a new window with a breakdown of the packets being captured for that protocol.

Part B: Why the Protocol Hierarchy is Useful
The “Protocol Hierarchy” option in the “Statistics” feature is useful for a number of reasons:

It provides a high-level overview of the protocols being used on your network. By seeing which protocols are being used the most, you can get a sense of the types of traffic that are generating the most activity on your network.

It helps you identify any potential problems with your network. For example, if you see that a particular protocol is being used much more frequently than others, it could be a sign that there is a problem with that protocol or that it is being used excessively.

It allows you to drill down into specific protocols to get more detailed information. By clicking on a specific protocol in the graph, you can open a new window with a breakdown of the packets being captured for that protocol, which can help you identify any issues with the packets or the protocol itself.

It helps you optimize your network by identifying any protocols that are using up too much bandwidth or causing other performance issues. By identifying and addressing these issues, you can improve the overall performance of your network.

Overall, the “Protocol Hierarchy” option in the “Statistics” feature in Wireshark is a valuable tool for network support technicians who are trying to troubleshoot connectivity issues and optimize network performance.

[SOLVED]Using Wireshark to Troubleshoot Network Connectivity Issues: Graphical Time Sequence (grep)

Using Wireshark to Troubleshoot Network Connectivity Issues: Graphical Time Sequence (grep)

In addition to the “Follow TCP Stream,” “Decode As,” “IO Graphs,” “Expert Infos,” “Time Sequence Graph (tcptrace),” and “Conversation Filter” features, Wireshark also includes a tool called the “Graphical Time Sequence (grep)” feature that allows you to visualize the flow of traffic between two devices over time in a graphical format.

To use the “Graphical Time Sequence (grep)” feature, simply select the “Statistics” menu and then choose “TCP Stream Graphs -> Time-Sequence Graph (Stevens).” This will open a new window that allows you to choose the stream that you want to visualize.

The “Graphical Time Sequence (grep)” feature shows the flow of traffic between two devices over time, with the x-axis representing time and the y-axis representing the sequence numbers of the packets being sent. You can use this tool to identify any problems with the flow of traffic, such as delays or missing packets.

By using the “Graphical Time Sequence (grep)” feature in combination with other diagnostic tools, such as the “Follow TCP Stream” and “IO Graphs” features, you can gain a deeper understanding of the traffic on your network and identify potential problems. With a little bit of practice and a thorough understanding of the features and techniques available in Wireshark, you can become an expert at troubleshooting network issues and keeping

[SOLVED] Using Wireshark to Troubleshoot Network Connectivity Issues: Conversation Filter

Using Wireshark to Troubleshoot Network Connectivity Issues: Conversation Filter

In addition to the “Follow TCP Stream,” “Decode As,” “IO Graphs,” “Expert Infos,” and “Time Sequence Graph (tcptrace)” features, Wireshark also includes a tool called the “Conversation Filter” that allows you to view the packets being exchanged between two specific devices or between devices using a specific protocol.

To use the “Conversation Filter” feature, simply select the “Statistics” menu and then choose “Conversations.” This will open a new window that displays a list of all the conversations that have been captured.

You can use the “Conversation Filter” feature to view the packets being exchanged between two specific devices or between devices using a specific protocol. To filter the conversations, you can use a variety of criteria, including the source and destination addresses, the protocol being used, and various other packet attributes.

The “Conversation Filter” feature is especially useful when you want to focus on a specific set of packets and see how they are being exchanged between devices. By using the “Conversation Filter” feature in combination with other diagnostic tools, such as the “Follow TCP Stream” and “IO Graphs” features, you can gain a deeper understanding of the traffic on your network and identify potential problems.

How to Use the Conversation Filter
To use the “Conversation Filter” feature in Wireshark, follow these steps:

Select the “Statistics” menu and then choose “Conversations.”
In the “Filter” field at the top of the window, enter the criteria that you want to use to filter the conversations.
Click the “Apply” button to apply the filter and display the filtered conversations.
For example, if you want to see the packets being exchanged between two specific devices, you can enter the IP addresses of the devices in the “Filter” field. If you want to see the packets being exchanged between devices using a specific protocol, you can enter the name of the protocol in the “Filter” field.

With a little bit of practice and a thorough understanding of the features and techniques available in Wireshark, you can become an expert at troubleshooting network issues and keeping your network running smoothly